
Brooklyn, NY · Multi-Family
BK Multi-Family Savings Report
Actual water and sewer billing results, same season one year apart, vs. projected 10-year savings from conservation upgrades.
Water Usage Savings
842 → 506 HCF, same quarter YoY
Water & Sewer Charge Savings
$10,620.40 → $6,618.23, same quarter
Actual Payback Period
based on savings achieved to date
Actual Property Value Added
at a 6% cap rate
Actual Quarterly Results
Same season, year over year · Q ended 6/17/25 → Q ended 6/17/26 (per DEP water bills)
- Water Usage (HCF)
- 842506
- Water & Sewer Charge
- $10,620.40$6,618.23
Quarterly savings: $4,002.17 - a 37.7% lower bill for the same 90-day season.
Installation Cost & Modeled Payback
Upgrade cost: $12,000 | Baseline annual water & sewer cost: $37,461 (trailing 12 mo.)
| Usage Reduction | Year-1 Savings (2026) | Payback | Value Added (6% Cap) |
|---|---|---|---|
| 10% | $3,971 | 2.9 years | $66,181 |
| 20% | $7,942 | 1.5 years | $132,362 |
| 30% | $11,913 | ~1.0 year | $198,544 |
Conservative modeled scenarios shown for reference - actual measured performance already exceeds the 30% case.
Water Usage by Billing Quarter (HCF)
Actual NYC DEP meter reads · amber = the matched comparison quarters (Spring '25 vs. Spring '26)
Spring '25
3/20-6/17
Summer '25
6/17-9/18
Fall '25
9/18-12/17
Winter '26
12/17-3/19
Spring '26
3/19-6/17
Source: NYC DEP Water & Wastewater bills (6/27/25, 9/29/25, 12/29/25, 3/30/26, 6/29/26). Baseline annual cost = sum of water/sewer charges for the four quarters 3/20/25-3/19/26 ($37,461.07); escalated 6%/yr from 2026. Actual payback and property value use the 37.7% bill reduction measured on the Spring '25 → Spring '26 comparison bills, applied to the same escalating baseline. 10%/20%/30% rows are conservative modeled scenarios. Property value added = Year-1 annual savings ÷ 6% cap rate; illustrative, not an appraisal.
Local NYC Case Study
Proven
Results.
Fulton Avenue · Brooklyn, NY
*Projected from verified data and the property's actual NYC DEP water and sewer rate (~$13.05/HCF combined).
Fulton Avenue
Methodology - apples to apples.
How it was measured
- Property
- Fulton Avenue, Brooklyn, NY
- Account
- NYC DEP #3000301XXXXXXX
- Meter ID
- G15006323 (E-REG 924863)
- Measurement Window
- Feb 9, 2026 → Apr 22, 2026 (73 days)
- Meter reads
- Photographed actual meter readings
- Baseline source
- 12 months of NYC DEP actual-read bills
- Baseline window
- Same 73 calendar days, prior year
All readings verified by actual NYC DEP water bills and photographed meter registers. No estimates.
The numbers
| BEFORE | AFTER | Δ | |
|---|---|---|---|
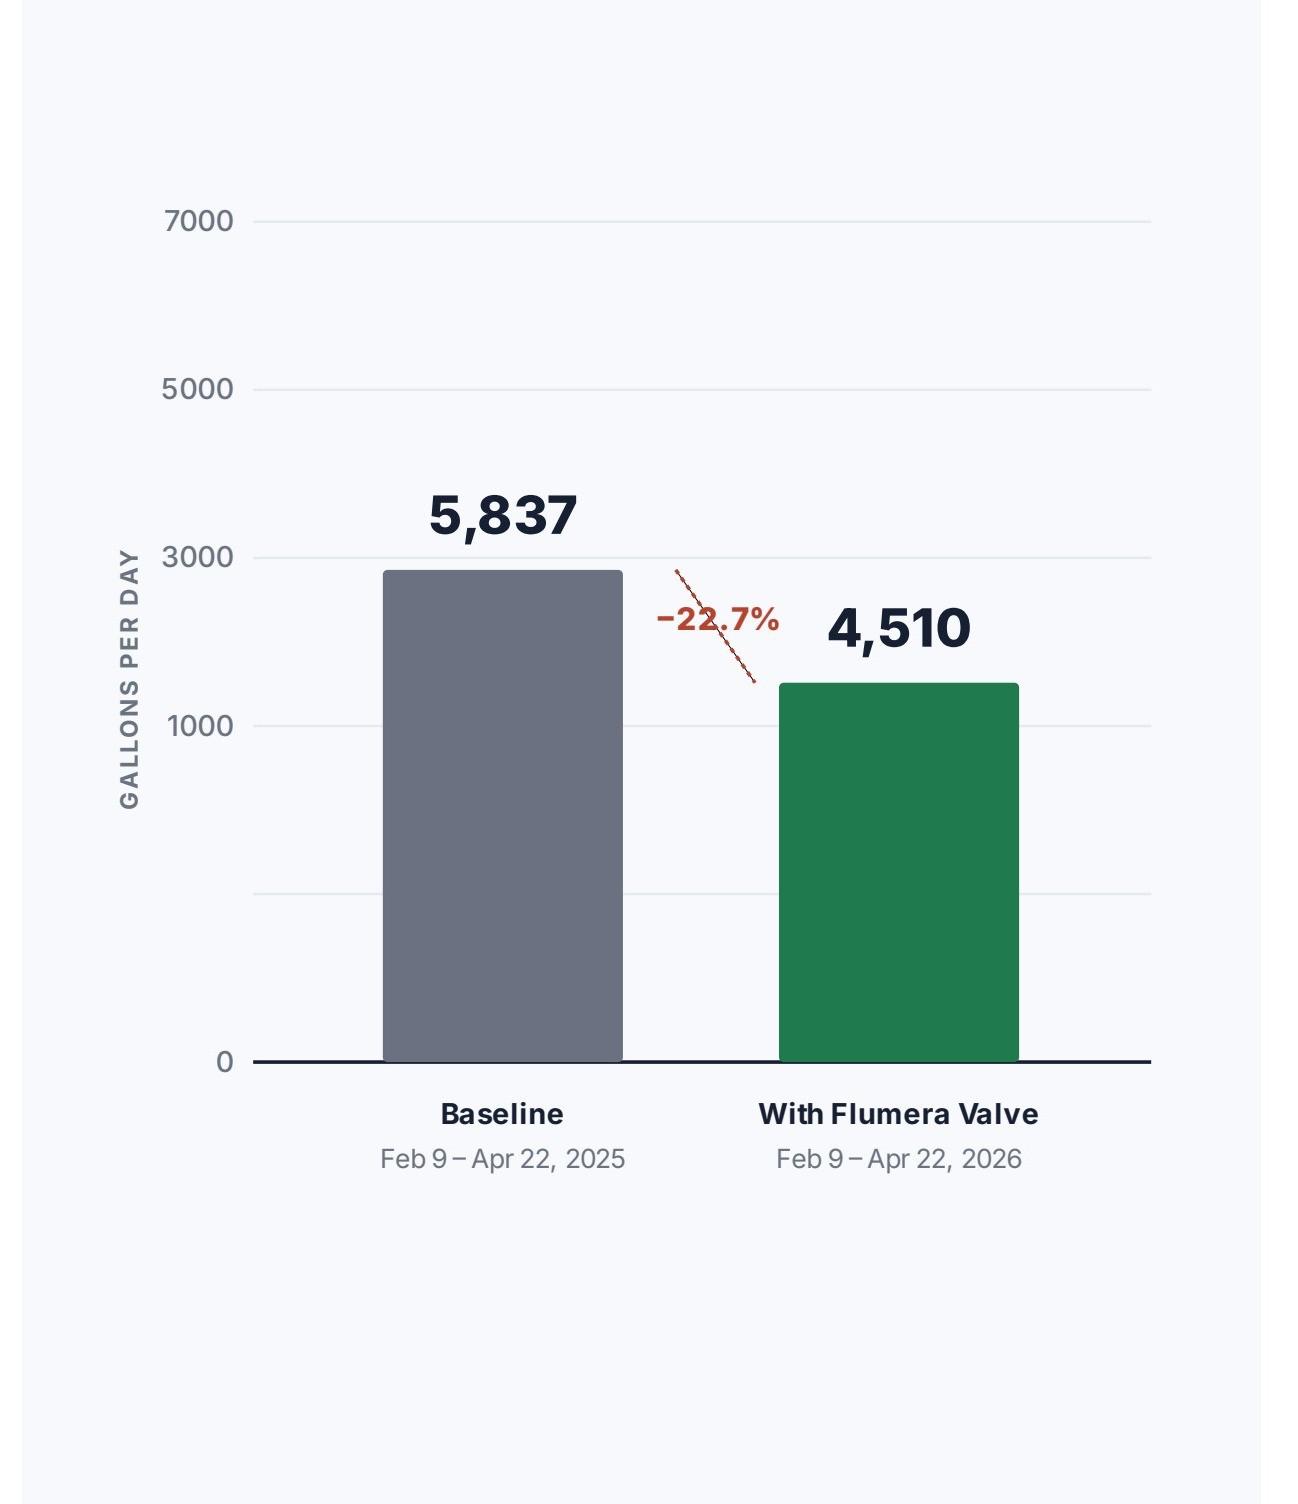
| Daily usage (gal) | 5,837 | 4,510 | -1,327 |
| Daily usage (HCF) | 7.80 | 6.03 | -1.77 |
| 73-day total (gal) | 426,090 | 329,195 | -96,895 |
| 73-day total (HCF) | 569.6 | 440.1 | -129.5 |
| Reduction | - | - | -22.74% |
What it costs - and saves
- Combined water + sewer rate (post 7/1/25)
- ~$13.05 / HCF
- Trailing 12-month spend at Fulton Avenue
- ~$36,900
- Verified reduction applied annually
- ~$8,400 / yr
- 10-year projected savings (5% rate inflation)
- ~$105,000+
Fulton Avenue
Same property. Same season. Less water.
Daily water usage at Fulton Avenue - measured across the same 73-day window in consecutive years.
The story
saved every single day.
Across 73 days, that's enough water to fill more than 1,750 standard bathtubs - water the building previously paid for, but did not actually consume.
Data source
NYC DEP actual-read water bills (4 quarters) + photographed meter readings on Feb 9, 2026 and Apr 22, 2026.
Real Customers
What people are saying.
Testimonial Letters from actual conversations with property owners and managers who saw real results.